Freight Reporting & DashboardsPrivate
Freight forwarder · 2024 – 2025
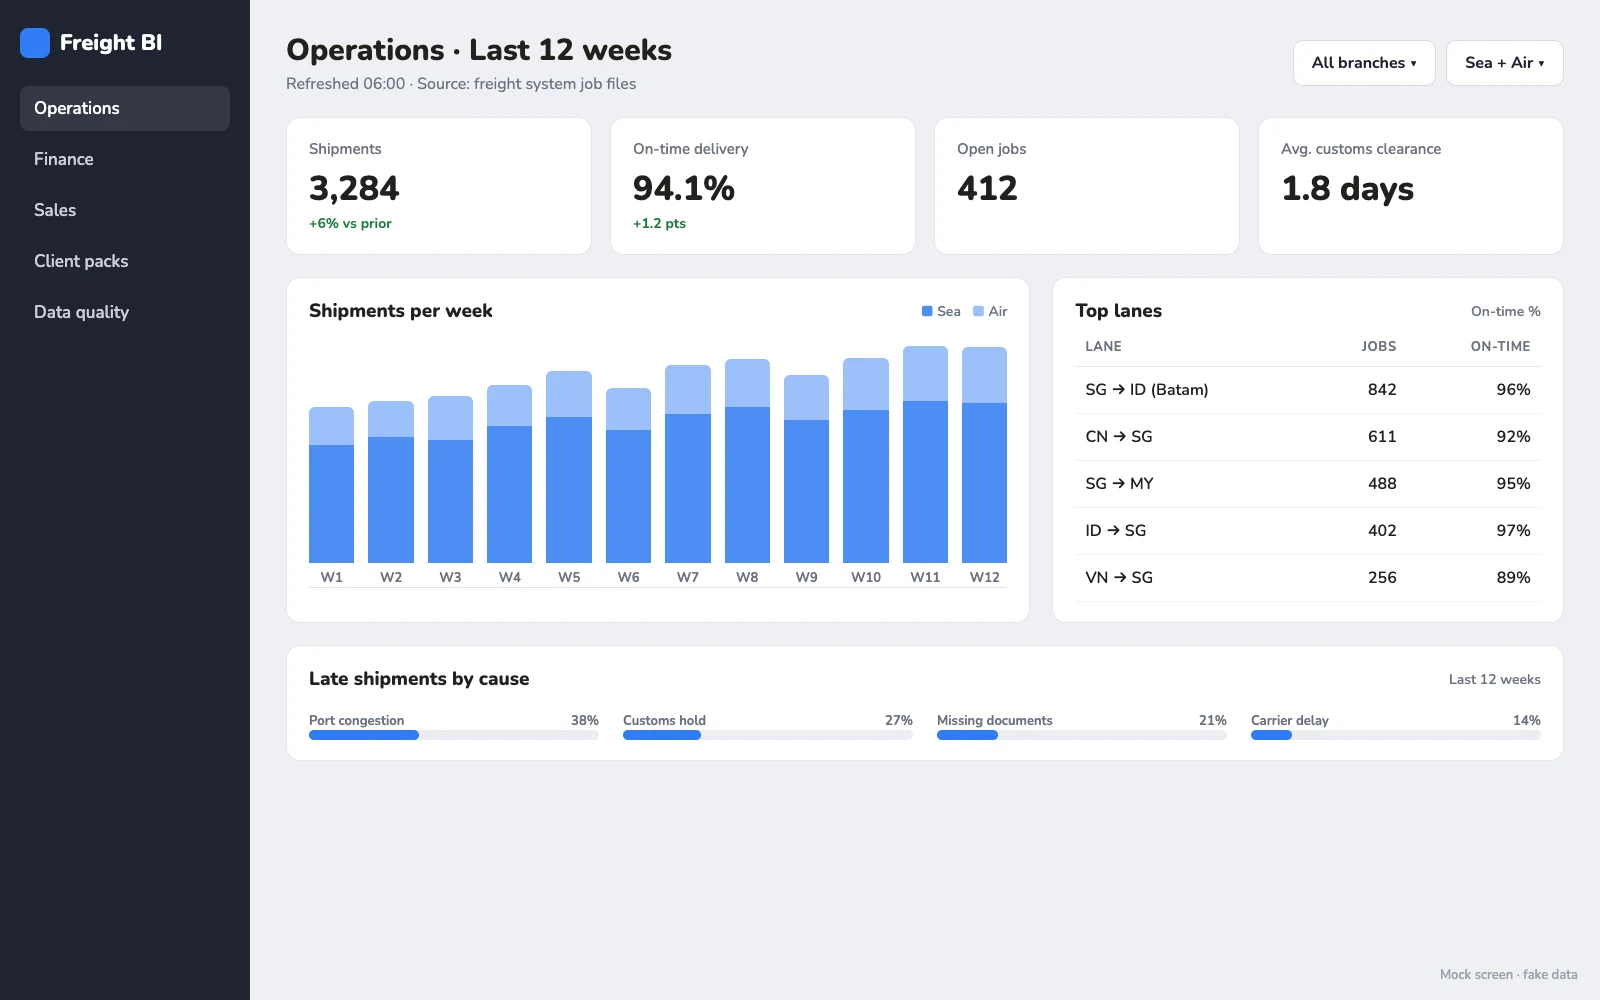
At a freight forwarder, each department had its own reports and its own version of the numbers. I designed and optimized the reporting layer on top of the company's freight system, so operations, finance and sales read from one model.
Job files, shipments, milestones and invoices flow into cleaned SQL report views with one definition per metric, then into a Power BI model with shared measures and a scheduled refresh. On top of that sit dashboards per department (on-time delivery and open jobs, margin per job, volume per trade lane) and Excel and PDF report packs for overseas clients.
Much of the work was with people. I gathered with clients what each report had to answer, and checked the numbers with them against their own records before anything shipped, partly in person with clients in Singapore. I also wrote ERDs, system diagrams and API documentation, and took part in system architecture and database design.
Built with SQL, Excel, Power BI and the company's freight system. The company and its clients are private, so the dashboard here is redrawn with fake data.