charton
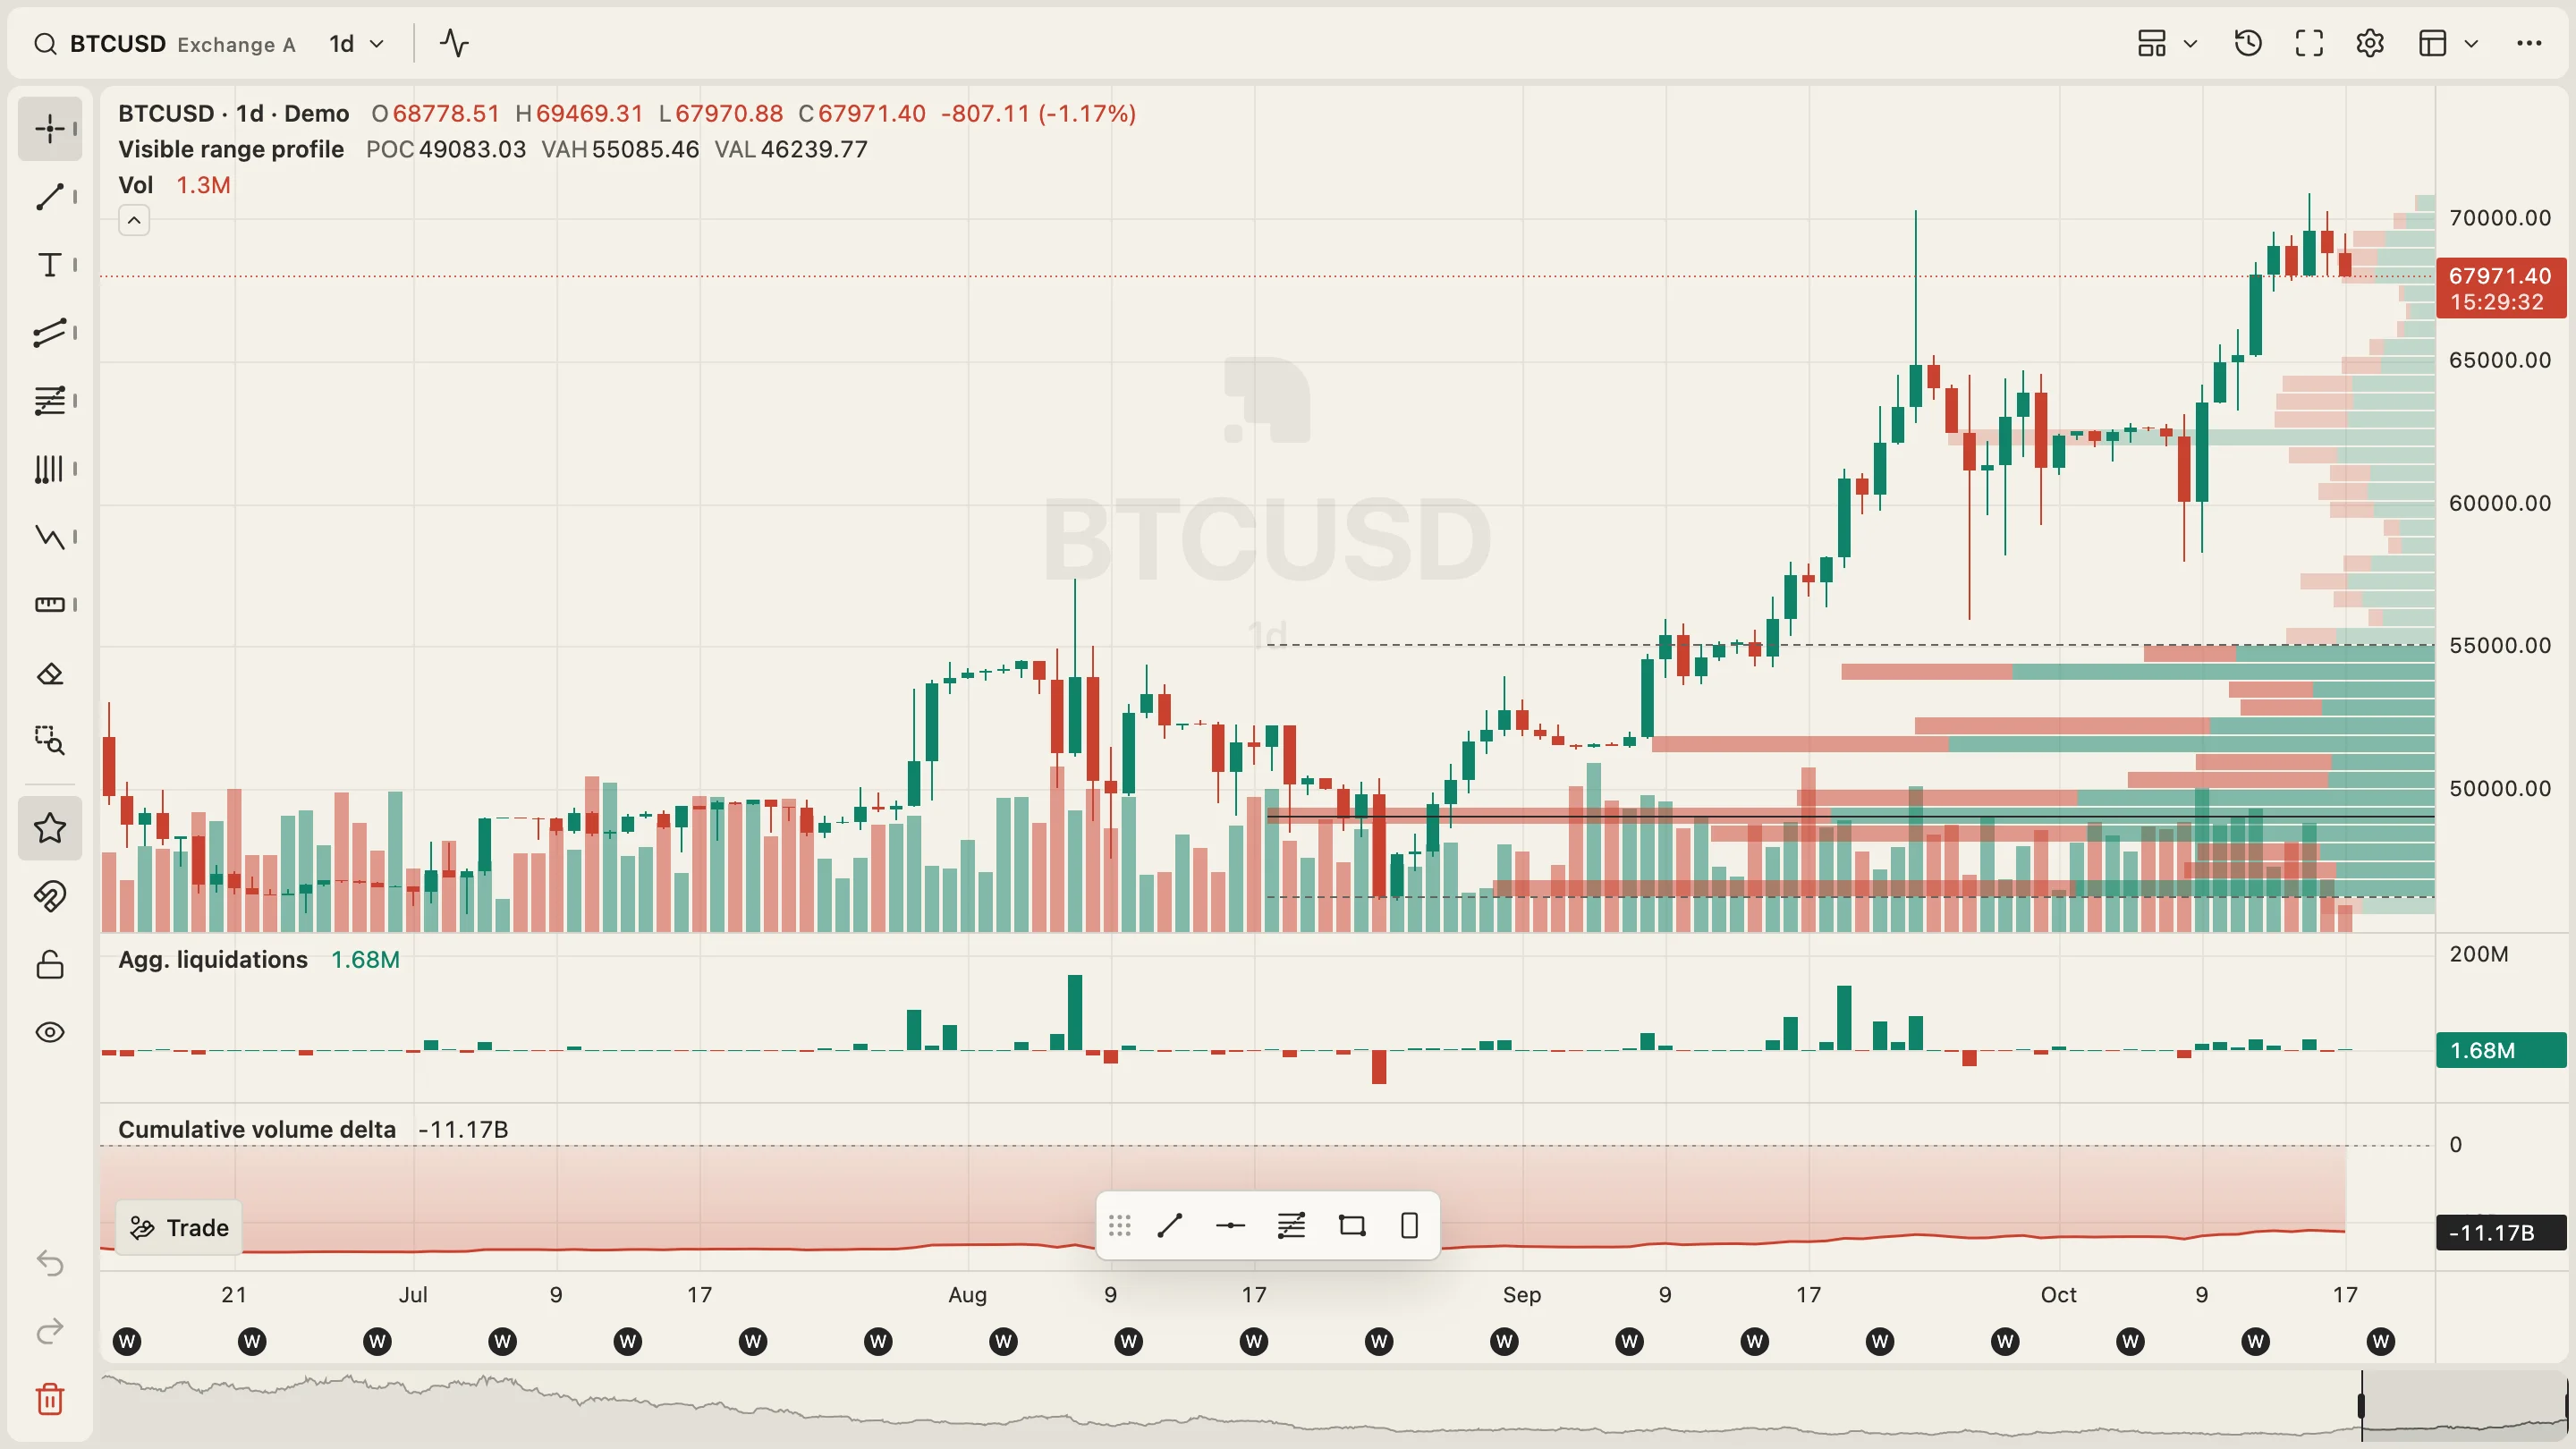
charton is an open-source (Apache-2.0) charting library for financial data, written in strict TypeScript and rendered with WebGL2. Candles, bars, histograms, heatmaps and volume profiles are drawn on the GPU, and the data is uploaded once, so panning and zooming through long histories stays smooth.
The engine (@charton/core) is headless and has zero runtime dependencies, so it works with any UI. An optional UI package adds a toolbar, drawing rail, dialogs and themes, and thin wrappers bring it into React, Vue and Svelte. It covers sixteen candle styles, liquidation and order-book heatmaps, footprint bars, multi-pane layouts, linked chart grids, seasonality views and charts with a numeric x-axis.
Indicators are pure TypeScript functions, drawings support undo and redo, and plugin contracts let developers add their own indicators, drawing tools and series. Optional features are tree-shakeable, a plain chart bundle stays under 100 KiB gzip, and CI enforces a size budget per bundle. It also supports keyboard and touch input, screen readers, timezones, right-to-left layouts and seven languages.